Retail plan
Statistics
Revenue, margin and VAT by product, store, supplier and payment – including CSV.
The dashboard is your start page after signing in: today’s revenue, number of sales, average basket and margin for the last 7, 14 or 28 days. Almost every figure sits next to the value for the same days last year.
“Revenue today” shows the day’s revenue so far and the time of the latest purchase. A badge tells you whether the day is going better than a typical day of the same weekday.
Revenue per day, margin per day, average basket and sales sit next to the same days last year, with the change in percent.
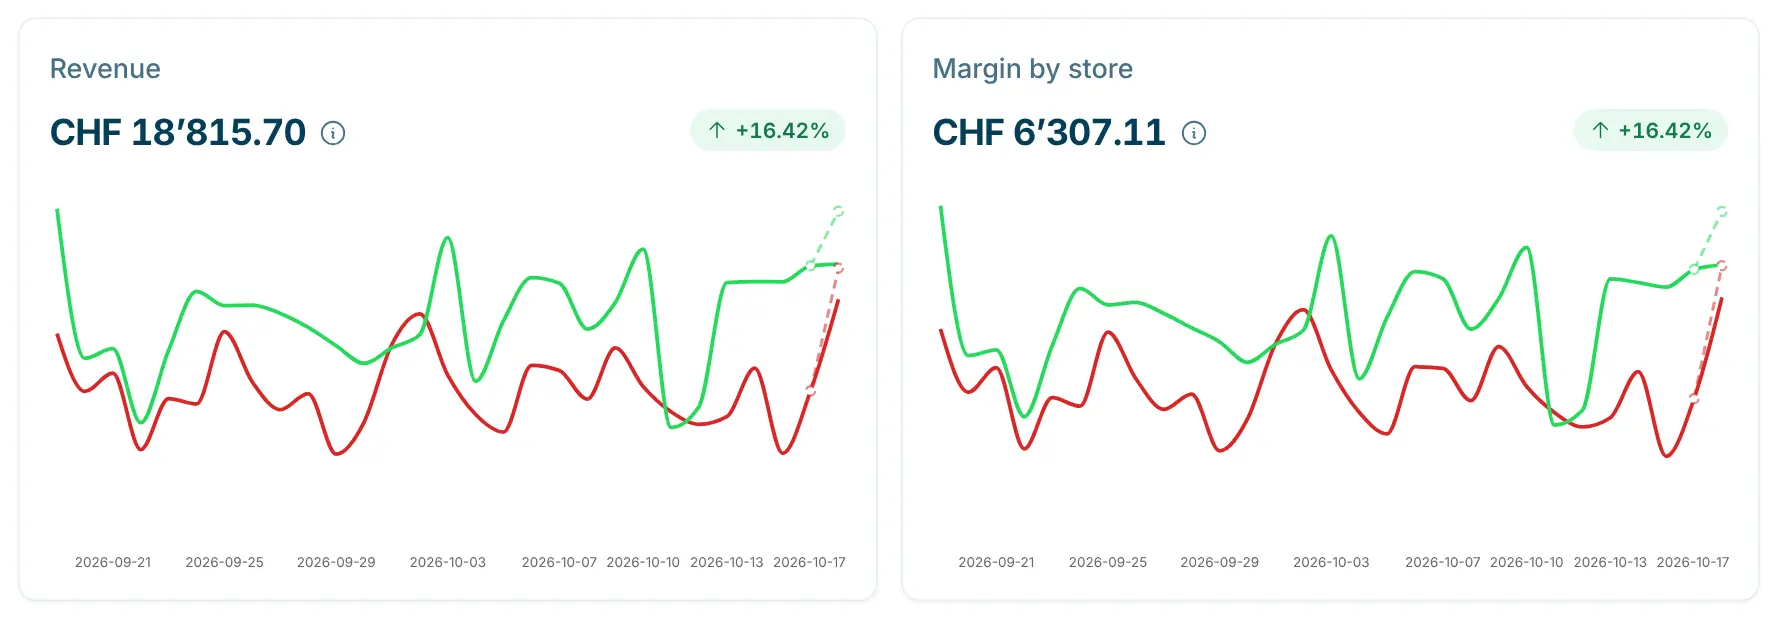
In the chart each store has its own line. With the store selector, every figure refers to a single location.
Nothing to export or add up. Every paid purchase flows into the dashboard by itself.
Only successful purchases count. Cancelled, failed and pending payments are left out.
Values for the current day are cached for up to about a minute. Reloading the page shows the latest state.
Last 7, 14 or 28 days, always ending today. Your choice is saved in the browser.
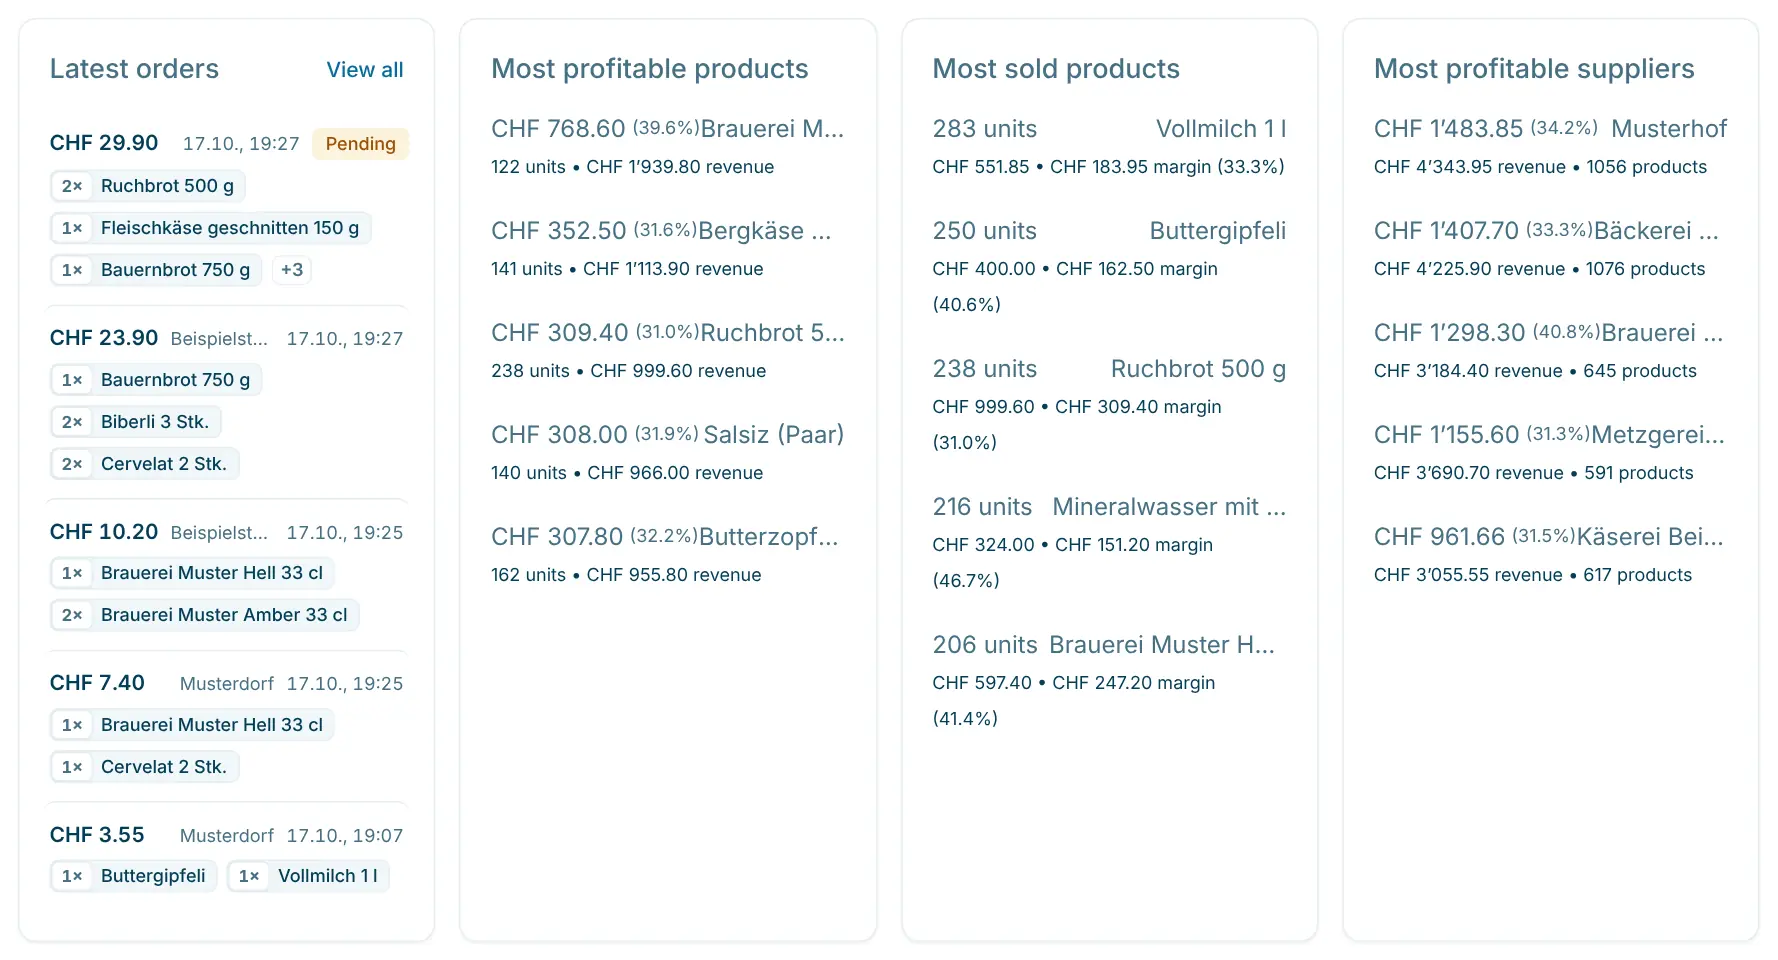
One click in “Latest orders” opens the purchase with all line items; “View all” takes you to the full list.
The images come straight from the Cloud Dashboard, filled with sample data.
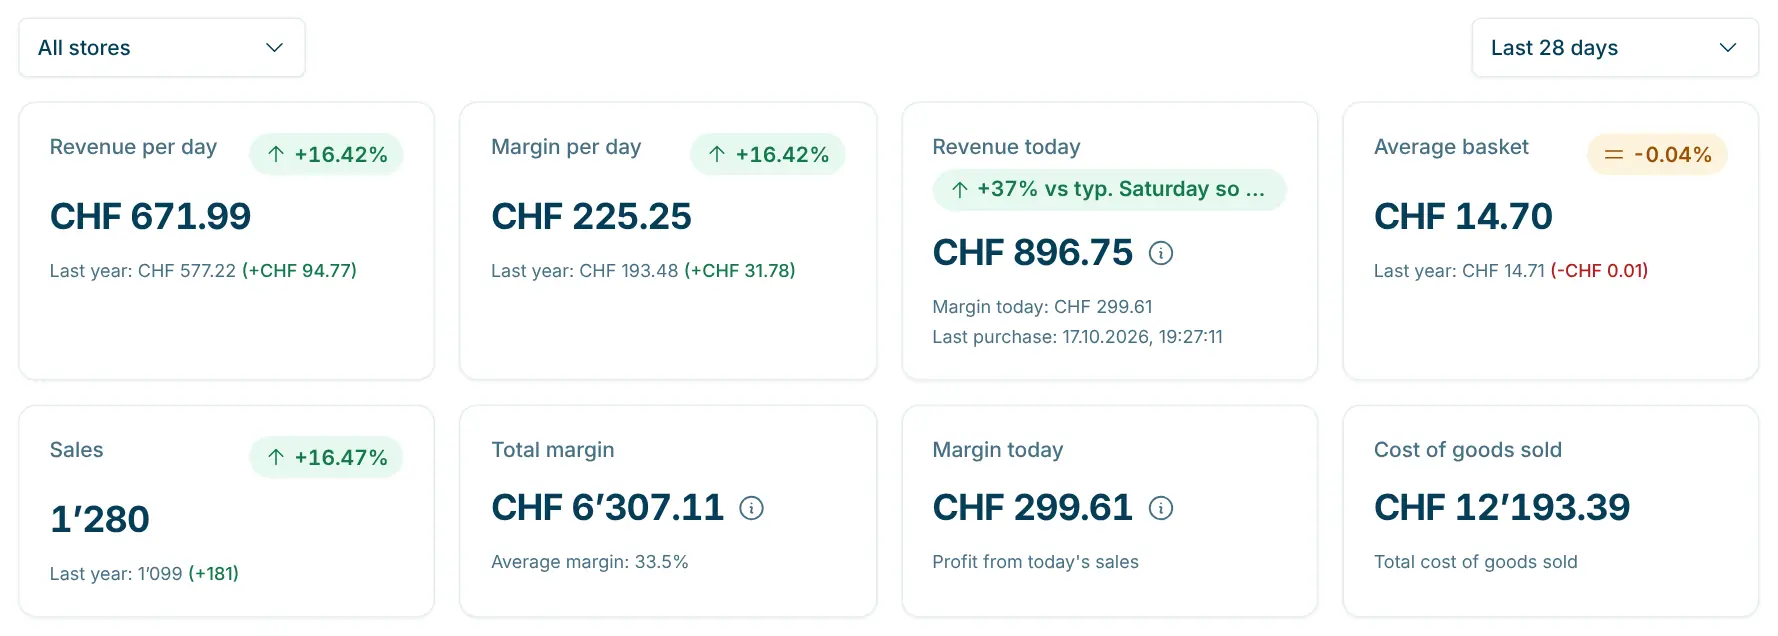
Key figures with year-on-year comparison
Revenue per day, revenue today, average basket and sales. If cost prices are recorded, margin per day, total margin, margin today and cost of goods sold are added.
Revenue and margin day by day
One line per store. For today, a dashed line shows the projection until the end of the day: revenue so far plus the typical rest of that weekday.
Latest orders and rankings
The last five purchases with products and status, plus the most sold and the most profitable products. The supplier ranking is available from the Retail plan.
The dashboard is built for a quick look: how is today going, how did the last few weeks go? Free date ranges, breakdowns by hour and weekday and a CSV export are in Statistics (Retail plan). Every single purchase with all line items is under Orders. Before your first sale, the dashboard shows demo data so you can already see what to expect.
Retail plan
Revenue, margin and VAT by product, store, supplier and payment – including CSV.
Retail plan
One catalogue, multiple locations – visibility, stock and sales per store.
Retail plan
Period reports for accounting – VAT, store and payment as PDF, Excel or CSV.
Yes, it is part of every plan, starting with the Basis plan at CHF 99.– per month. Only the supplier ranking requires the Retail or Pro plan.
Values for the current day are cached for up to about a minute, completed days a little longer. A new purchase shows up shortly after when you reload the page.
Today’s revenue so far is compared with the average revenue of the same weekday in the selected period, prorated to the part of the day that has passed. Deviations of up to 3% count as normal and are shown in a neutral colour.
Margins appear only if a cost price or a margin is recorded for the products sold, either on the product or as the store’s general margin. Real cost prices make them more accurate.
The dashboard counts only successful purchases; the Orders page shows every status. Selling and topping up gift cards does not count as revenue in the dashboard.
No. Users with the Employee role go straight to Orders. The dashboard is visible to Members, Admins and Owners.

Happy to help. Sign up for free to get a first impression – or request a non-binding quote. I’m here if you have questions.
Tobias Kobelt · scango.ch