FeatureRetail plan
Statistics
Pick any period, from “Today” to “Last year” or down to the minute, and narrow it by store, category or supplier. Statistics shows revenue, margin, peak hours and detailed data per product, and compares with an earlier period if you like.
Why it matters
Understand where the revenue comes from
Spot peak hours
“Sales by Hour” and “Sales by Weekday” show when people shop and which hours are quiet enough for restocking.
Compare periods
Previous period, one week earlier or the same period last year: every tile shows the change in percent and the comparison value.
Analyse per supplier
With a supplier or category filter, only the matching products of a purchase count. That way you see the revenue of a single supplier.
How it works
How to build an analysis
The page opens with the last 7 days. Everything else is set in the filter bar.
1 Choose a period
A preset such as “Last 30 days”, “Last month” or “This quarter”, or enter From and To with a time yourself.
2 Set comparison and filters
Optionally pick a comparison period and narrow down by store, category or supplier.
3 Apply
Statistics recalculates only when you click “Apply”. “Reset” brings back the last 7 days.
4 Export CSV
In Detailed Data, pick a tab such as Products or Suppliers and download the table for Excel.
In the dashboard
Four sections, one analysis
The images come straight from the Cloud Dashboard, filled with sample data.
app.scango.ch

- 1
Filter bar
Period, comparison period, store, category and supplier. The selected filters are part of the page address, so you can bookmark an analysis.
app.scango.ch - 2
Overview with comparison
Baskets, revenue incl. and excl. VAT, products sold, VAT and margin, plus gift cards redeemed and topped up. With a comparison, each figure shows the comparison value below it.
app.scango.ch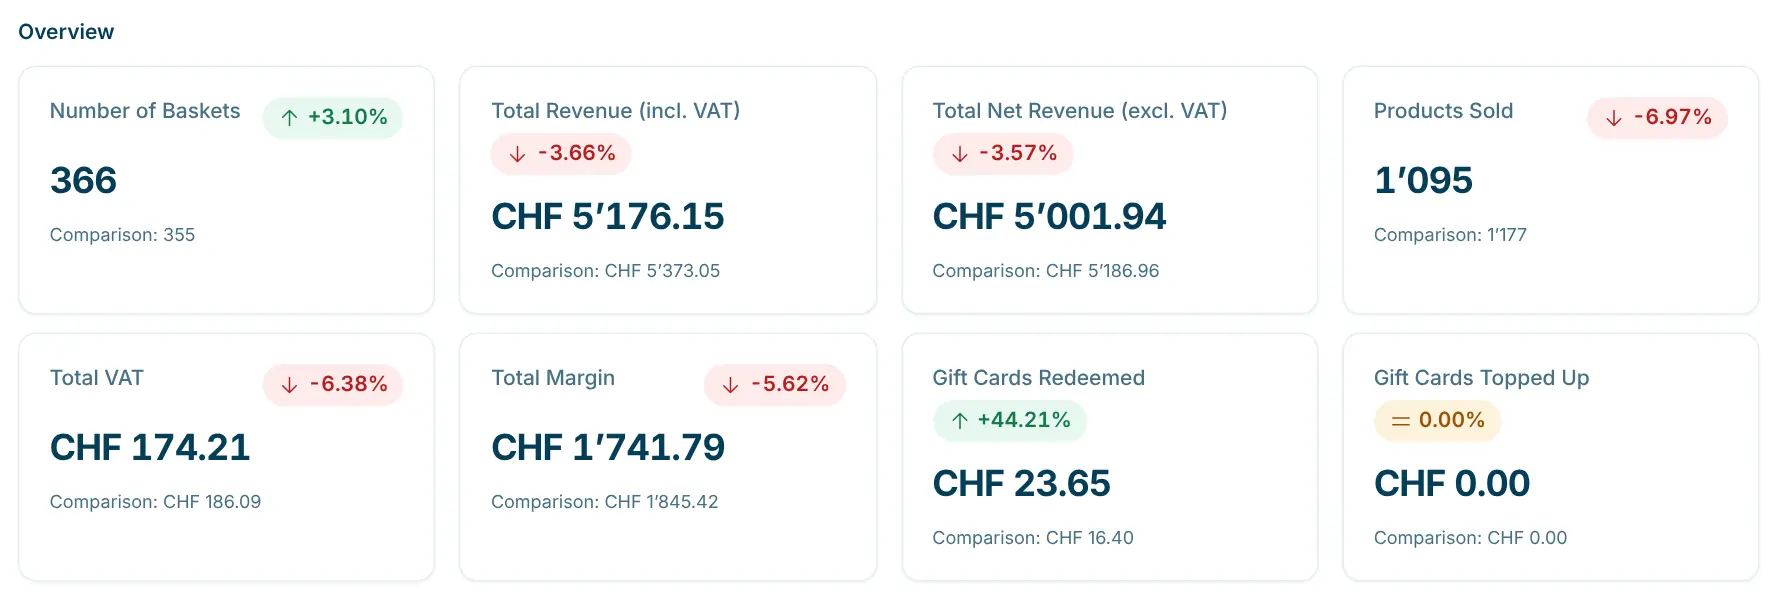
- 3
Trends by hour and weekday
One line each for revenue and purchases. In the example, Saturday is the strongest day and 8 a.m. the busiest hour.
app.scango.ch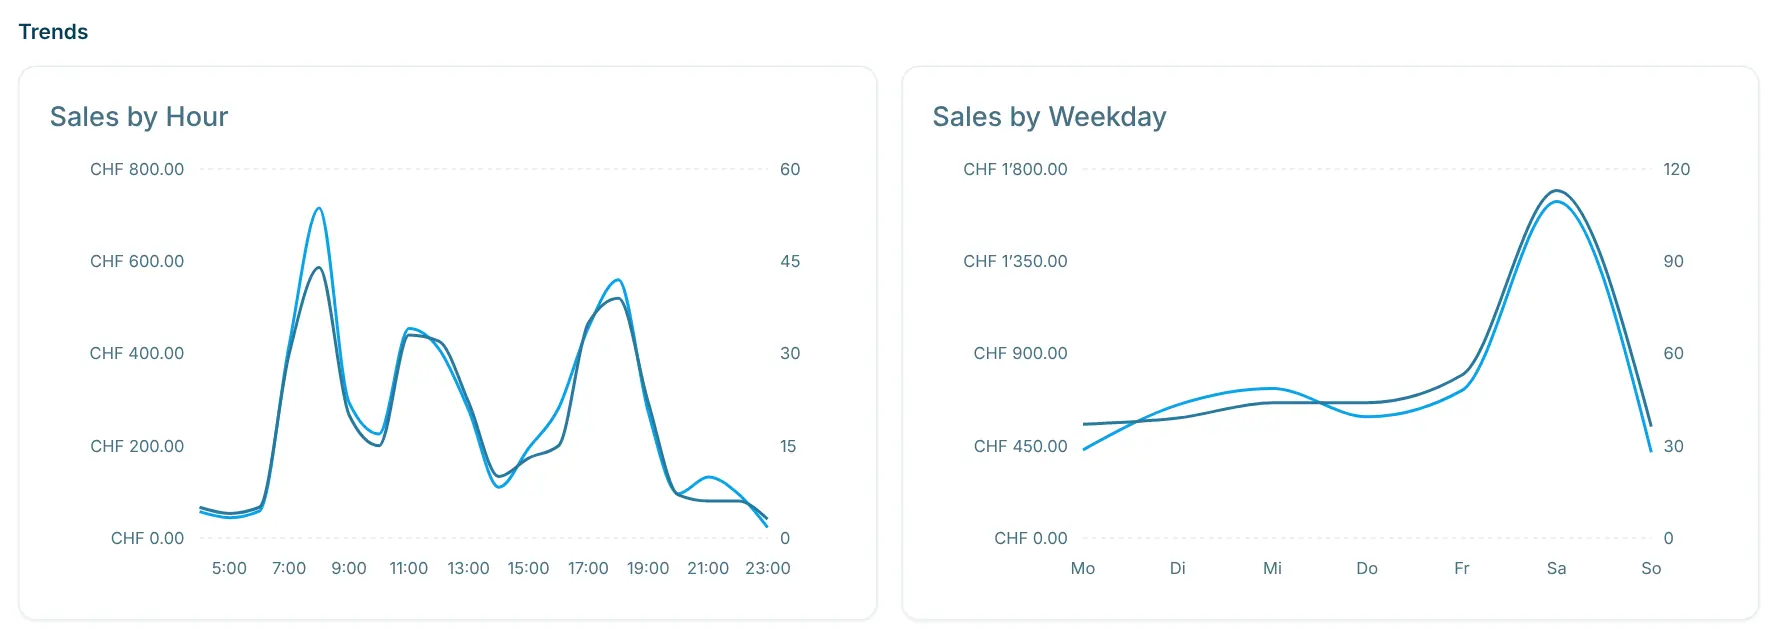
- 4
Detailed data per product
Tabs for products, categories, stores, suppliers, payment method and payment type. Sort, filter, show or hide columns and export as CSV.
app.scango.ch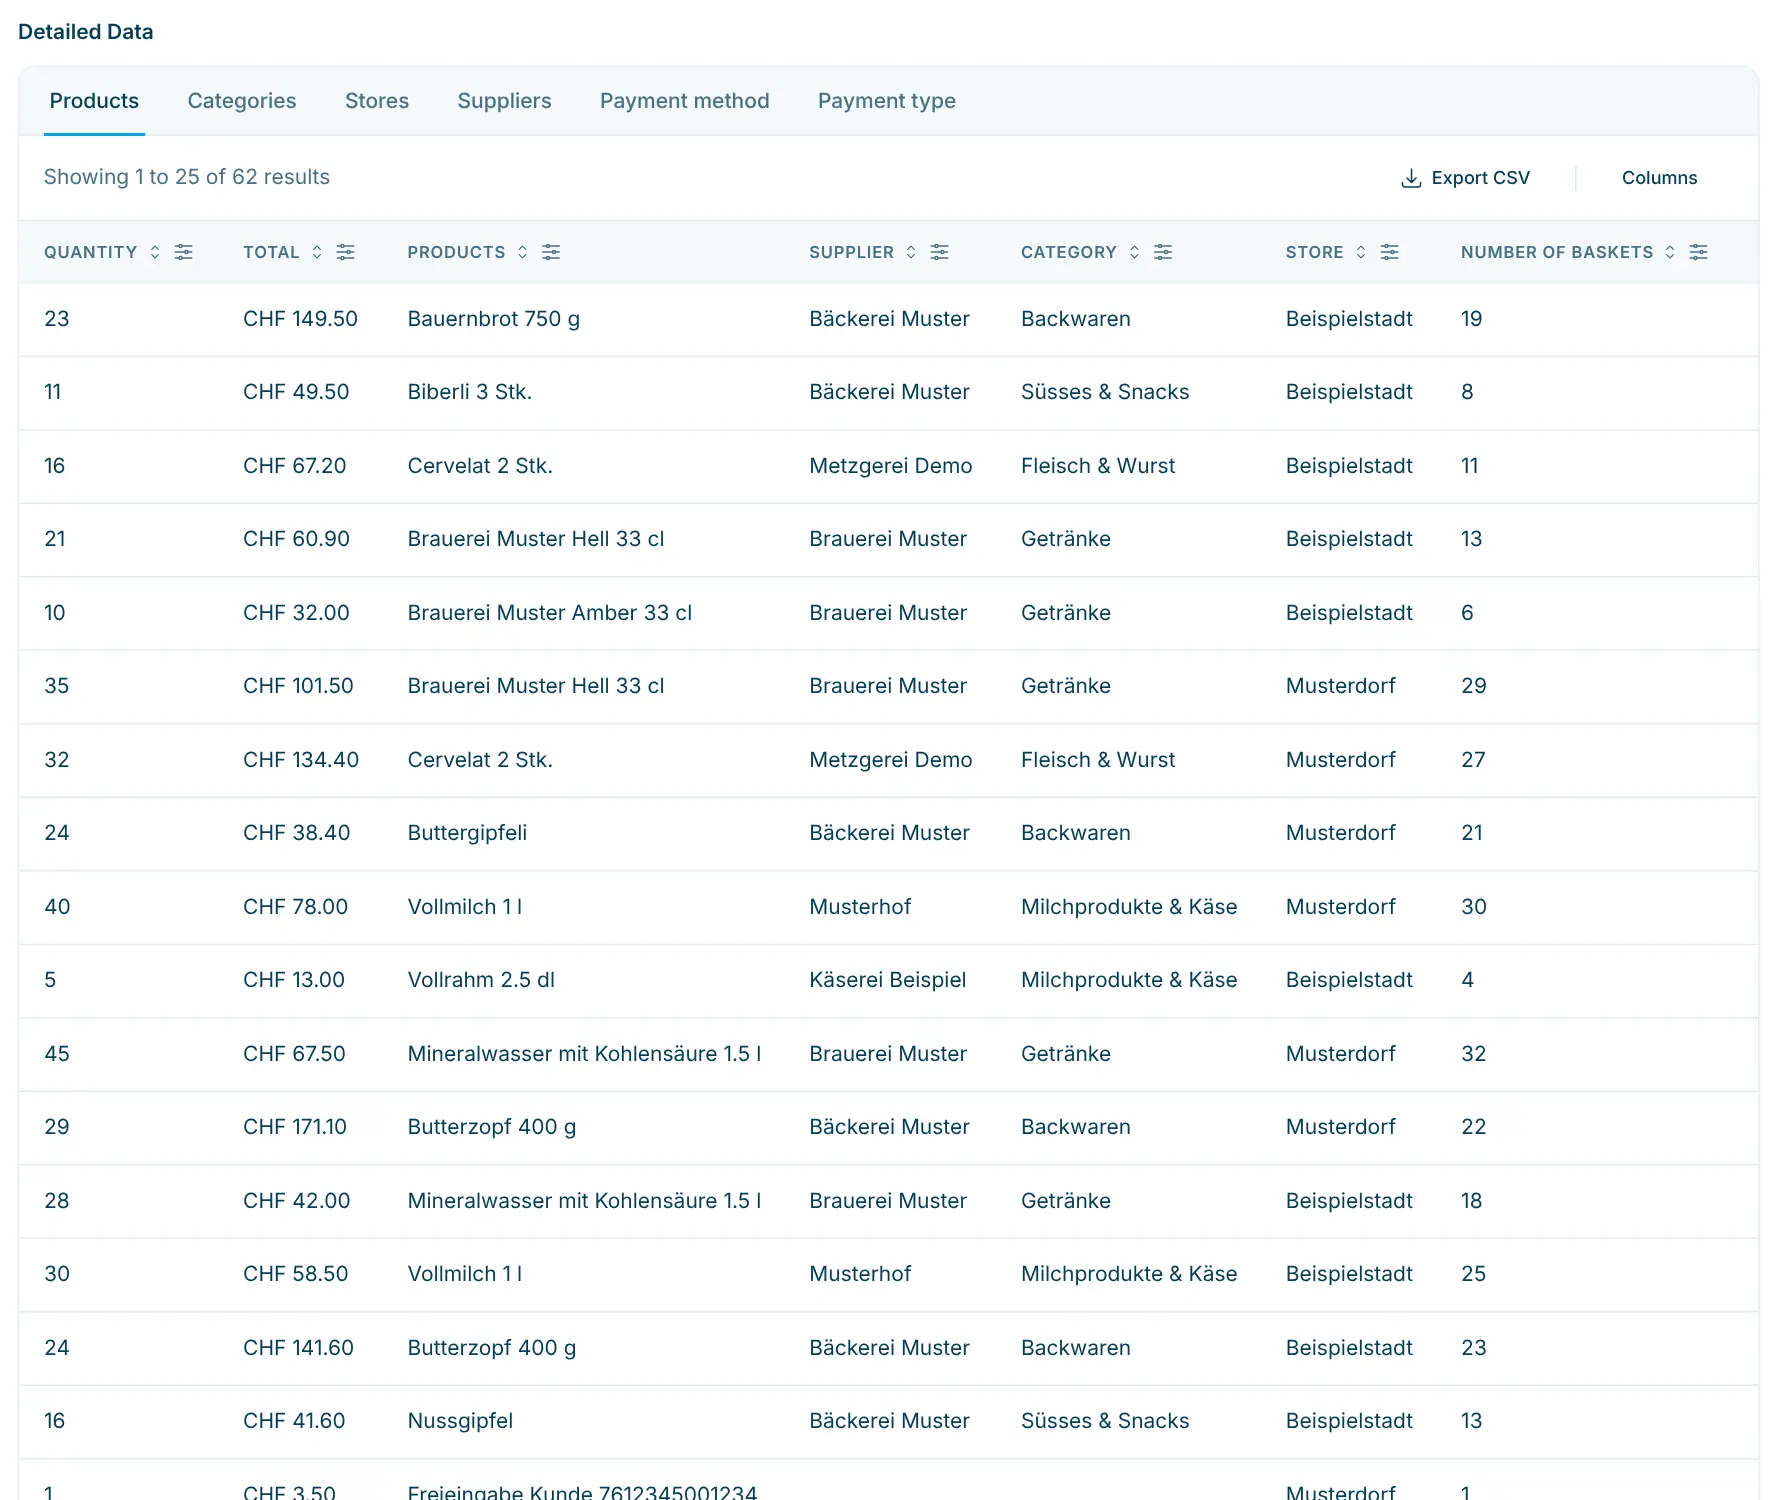
- Read the full guide
Good to know
For the questions behind the daily business
Which products sell, which suppliers bring revenue, on which days and at which hours is the shop busy? That is what Statistics is for. For a quick look at today, the dashboard included in every plan is enough. Suppliers who should see their own sales get a supplier dashboard of their own in the Pro plan.
- Plan
- Retail or Pro
- Access
- from the Member role
- Margin
- cost price recorded on the product
- Periods
- presets or free with time of day
- Comparison
- earlier period or last year
- Counted
- successful purchases, cancelled ones excluded
- Export
- CSV per tab
- Retail plan
- CHF 179.–/month, first checkout included
- Each additional checkout
- CHF 59.–/month
Requirements
In operation
Costs
scango.ch
More features
Retail plan
Financial reports
Period reports for accounting – VAT, store and payment as PDF, Excel or CSV.
Pro plan
Supplier dashboard
Shop-in-shop: suppliers see sales, top products and peak hours via their own link.
Frequently asked questions
How is this different from the dashboard?
The dashboard shows the last 7, 14 or 28 days at a glance and is part of every plan. Statistics offers free periods, comparisons, breakdowns by hour and weekday, detailed data and CSV export, in the Retail and Pro plans.
Why is the margin off?
The margin is only correct if a cost price is recorded on the product. For products without a cost price, the full selling price counts as margin.
Can I see the revenue of a single supplier?
Yes. With the supplier filter only that supplier’s products count, even if the same purchase contained other products. The Suppliers tab shows all suppliers side by side.
How do I get the raw data?
“Export CSV” downloads the data of the open tab, for example products.csv or suppliers.csv. For another grouping, switch tabs and export again.
Can I share an analysis with my team?
Yes. The filters are part of the page address. Send the link to a team member with access or save it as a bookmark.
How are discounts and gift cards counted?
Statistics deducts discounts proportionally from revenue. A redeemed gift card is a means of payment and does not reduce product revenue; it appears separately as “Gift Cards Redeemed”.

Hi, I’m Tobias.
Happy to help. Sign up for free to get a first impression – or request a non-binding quote. I’m here if you have questions.
Tobias Kobelt · scango.ch