Cloud Dashboard
Dashboard
The dashboard is your home page after signing in. It shows at a glance how your shop is doing: revenue today and in the selected period, the number of sales, the average basket, your margins, revenue trends per store, the latest orders and your top products and suppliers. Almost every figure is compared with the same period last year.
Open it from the menu under Dashboard. The roles Member, Admin and Owner have access. Users with the Employee role are taken straight to Orders. The dashboard is included in all plans; the supplier ranking requires the Retail or Pro plan.
Choose the period and store
At the top right, choose the period that the figures, charts and rankings refer to:
- Last 7 days
- Last 14 days
- Last 28 days (default)
The period always ends today. Your choice is saved in the browser and used again on your next visit.
If several stores made sales in the period, a store selector also appears at the top left. All stores shows the total of all stores. If you select a single store, all figures, charts and lists refer to that store only.
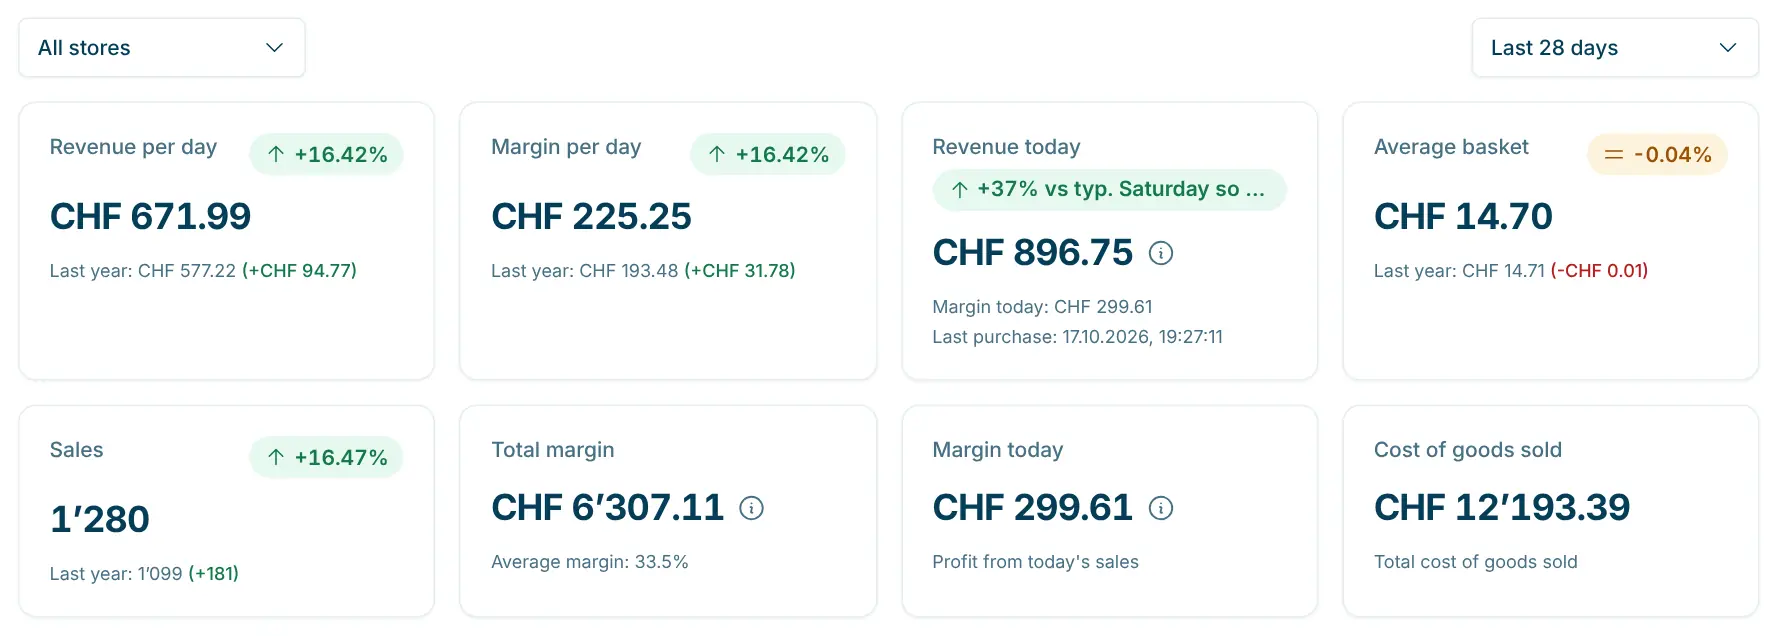
Key figures
The cards at the top show the most important figures for the selected period. All amounts are in CHF including VAT.
Card | Content |
|---|---|
Revenue per day | Average daily revenue in the period (revenue divided by the number of days). |
Revenue today | Revenue of the current day. Below it, Last purchase: shows the date and time of the latest successful order. A badge compares today's pace with a typical day (see below). |
Average basket | Average amount per order (revenue divided by the number of sales). |
Sales | Number of successful orders in the period. |
If cost prices are known for the products sold, the dashboard also shows margin cards:
Card | Content |
|---|---|
Margin per day | Average margin per day in the period. |
Total margin | Total margin in the period. Below it, Average margin: shows the margin as a percentage of revenue. |
Margin today | Profit from today's sales. It also appears on the Revenue today card as Margin today:. |
Cost of goods sold | Total cost of the goods sold in the period. |
Comparison with last year
The Revenue per day, Margin per day, Average basket and Sales cards compare the period with the same days last year:
- The badge at the top right shows the change in percent, green for an increase and red for a decrease. Hover over it to see the note "Compared to the same period last year".
- Below the figure you see last year's value, e.g. "Last year: CHF 812.40 (+CHF 57.10)".
Today's pace on "Revenue today"
The badge on the Revenue today card shows whether today is going better or worse than usual so far, e.g. "+12% vs typ. Wednesday so far". It compares today's revenue so far with the average revenue of the same weekday in the selected period, prorated to the part of the day that has already passed. Deviations of up to 3% count as normal and are shown in neutral colour.
If there is no revenue yet today, it reads "No revenue today yet". If the period contains no matching weekday to compare with, it reads "No comparison day".
Breakdown by store
Some amounts (e.g. Revenue today, Total margin, Margin today and the chart totals) have an ⓘ icon next to them. Hover over it to see the amount broken down by store.
Charts
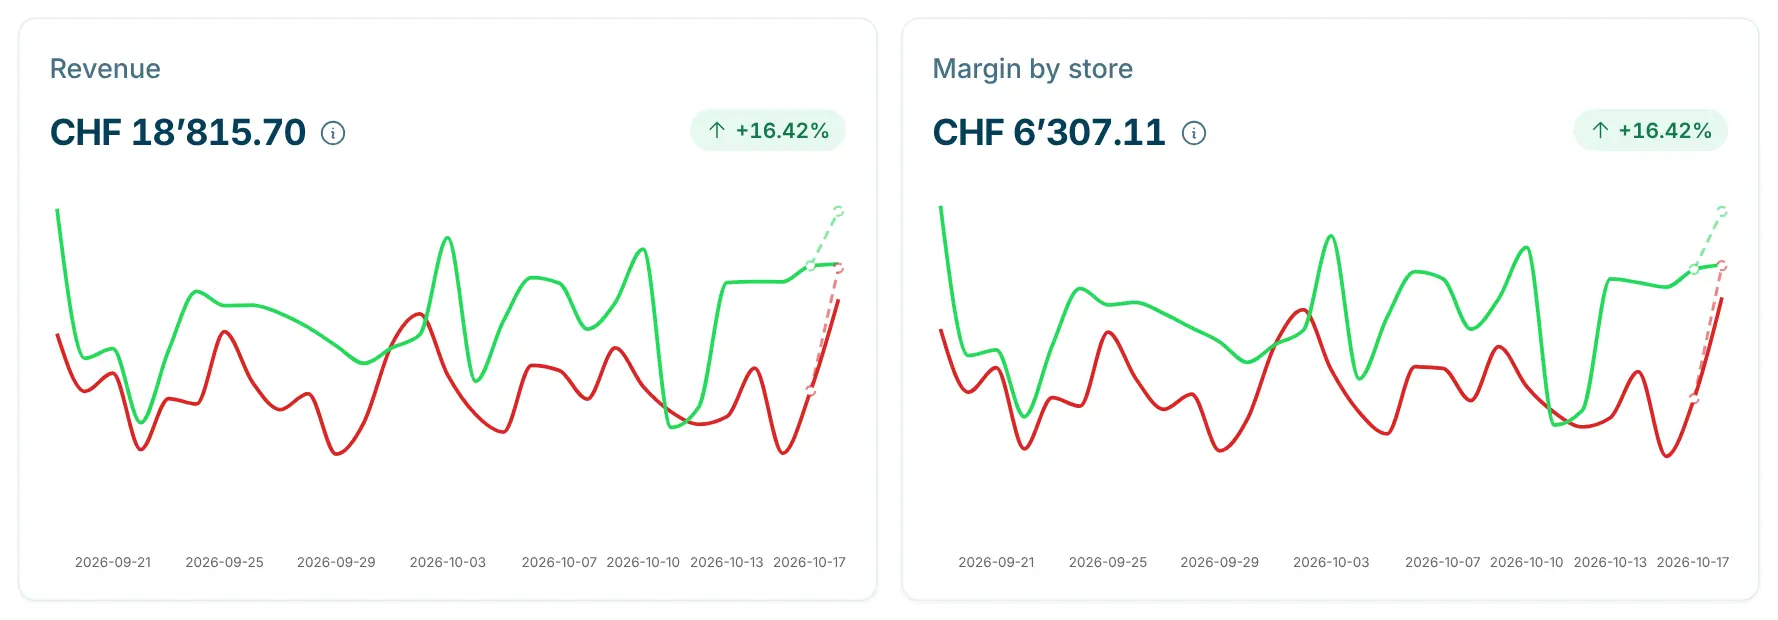
- Revenue: The total revenue of the period and the change compared to last year appear at the top. The chart shows revenue day by day, with one line per store. For today, a dashed line shows the Projection until the end of the day: revenue so far plus the typical remaining revenue for this weekday. Hover over a day to see the values per store and the Total:.
- Margin by store: The same view for the margin, including the margin as a percentage of revenue. This chart only appears when cost prices are known.
Lists
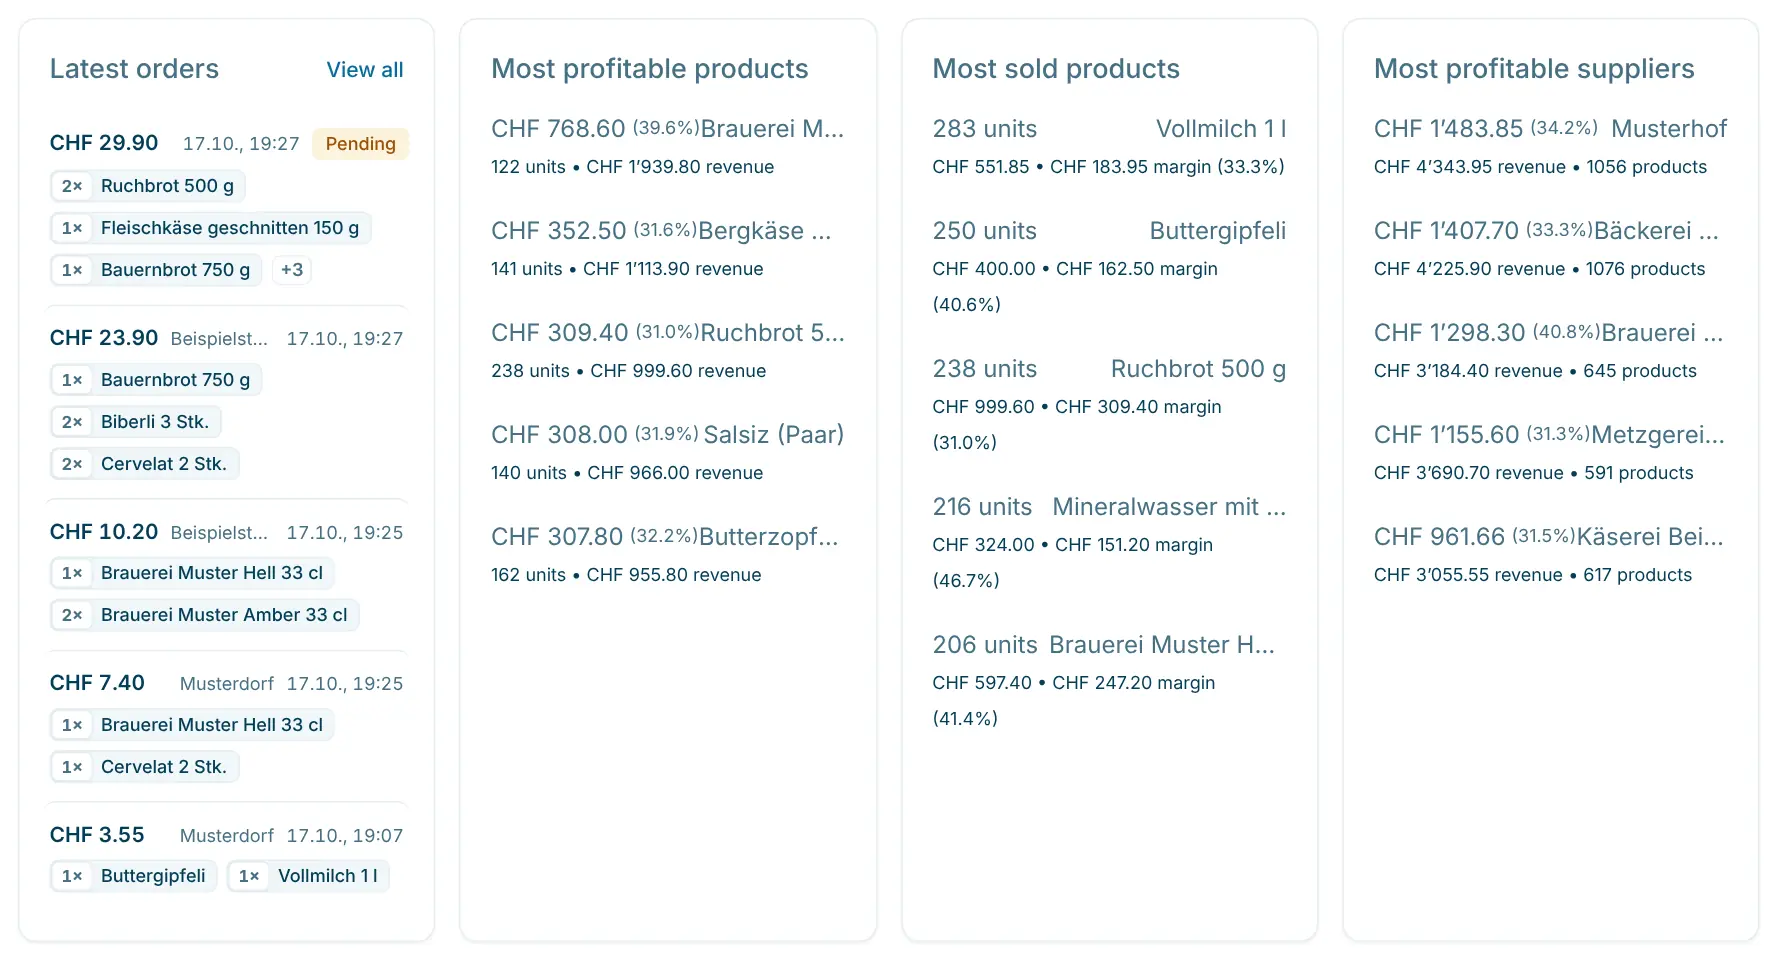
List | Content |
|---|---|
Latest orders | The five most recent orders with amount, date and time and the products bought, plus the store name if you have several stores. Orders that were not successful show their status (e.g. Pending or Failed); cancelled orders are struck through. Click an order to open it; View all takes you to the Orders page. |
Most sold products | The five products with the highest quantity sold in the period, with revenue and, if known, margin in CHF and percent. If a product has no cost price, it shows "No cost data". |
Most profitable products | The five products with the highest margin, with quantity and revenue. Only shown when cost prices are known. |
Best selling suppliers | The five suppliers with the highest revenue and the number of products sold. If cost prices are known, the list is called Most profitable suppliers and is sorted by margin. Retail and Pro plans only. |
How the figures are calculated
- Only successful orders count. Pending, cancelled, failed and timed-out orders are not included.
- Revenue is the order total including VAT. Selling and topping up gift cards does not count as revenue.
- Margin is the selling price minus the cost price for each line sold. Lines without a cost price do not add any margin.
- Cost prices come from the product's Cost price field. If it is empty, the kiosk calculates the cost price from the product's Margin or, if that is missing too, from the store's General margin for all products field (under Settings › Organization › Stores). The Products article explains how to maintain these fields.
- Freshness: Figures for the current day are cached for up to about one minute, completed days a little longer. A new order therefore appears after a short while; reload the page to see the latest figures.
Demo data before your first sale
If there is no successful order in the selected period yet, the dashboard shows sample data with the note "This is only demo data. Your data will be shown here after your first sale." This lets you see which reports to expect before you start. The sample orders cannot be opened. As soon as your first sale is recorded, your own figures appear.
Frequently asked questions
Why don't I see any margins?
The margin cards, the Margin by store chart and the Most profitable products list only appear when cost prices are available for the products sold. Enter the Cost price or the Margin in your products. For accurate margins we recommend real cost prices rather than flat margins.
Why is the store selector missing?
It only appears once at least two stores have made sales in the selected period.
Why does the revenue differ from the list of orders?
The dashboard only counts successful orders, whereas the Orders page lists orders with every status.
Where can I find longer periods or an export?
Custom periods, analyses by time of day and weekday and the export of detailed data are available under Statistics.